How Wideview works.

A private vault for your timeline, your relationships, and your context. Here's how it all fits together.

DEPT. OF COMPARATIVE BIOGRAPHYDashboardJournalRhythmsChronicleContactsNetworkEventsPeopleAction ItemsAnnual ReviewsFamous PeopleStoriesResume

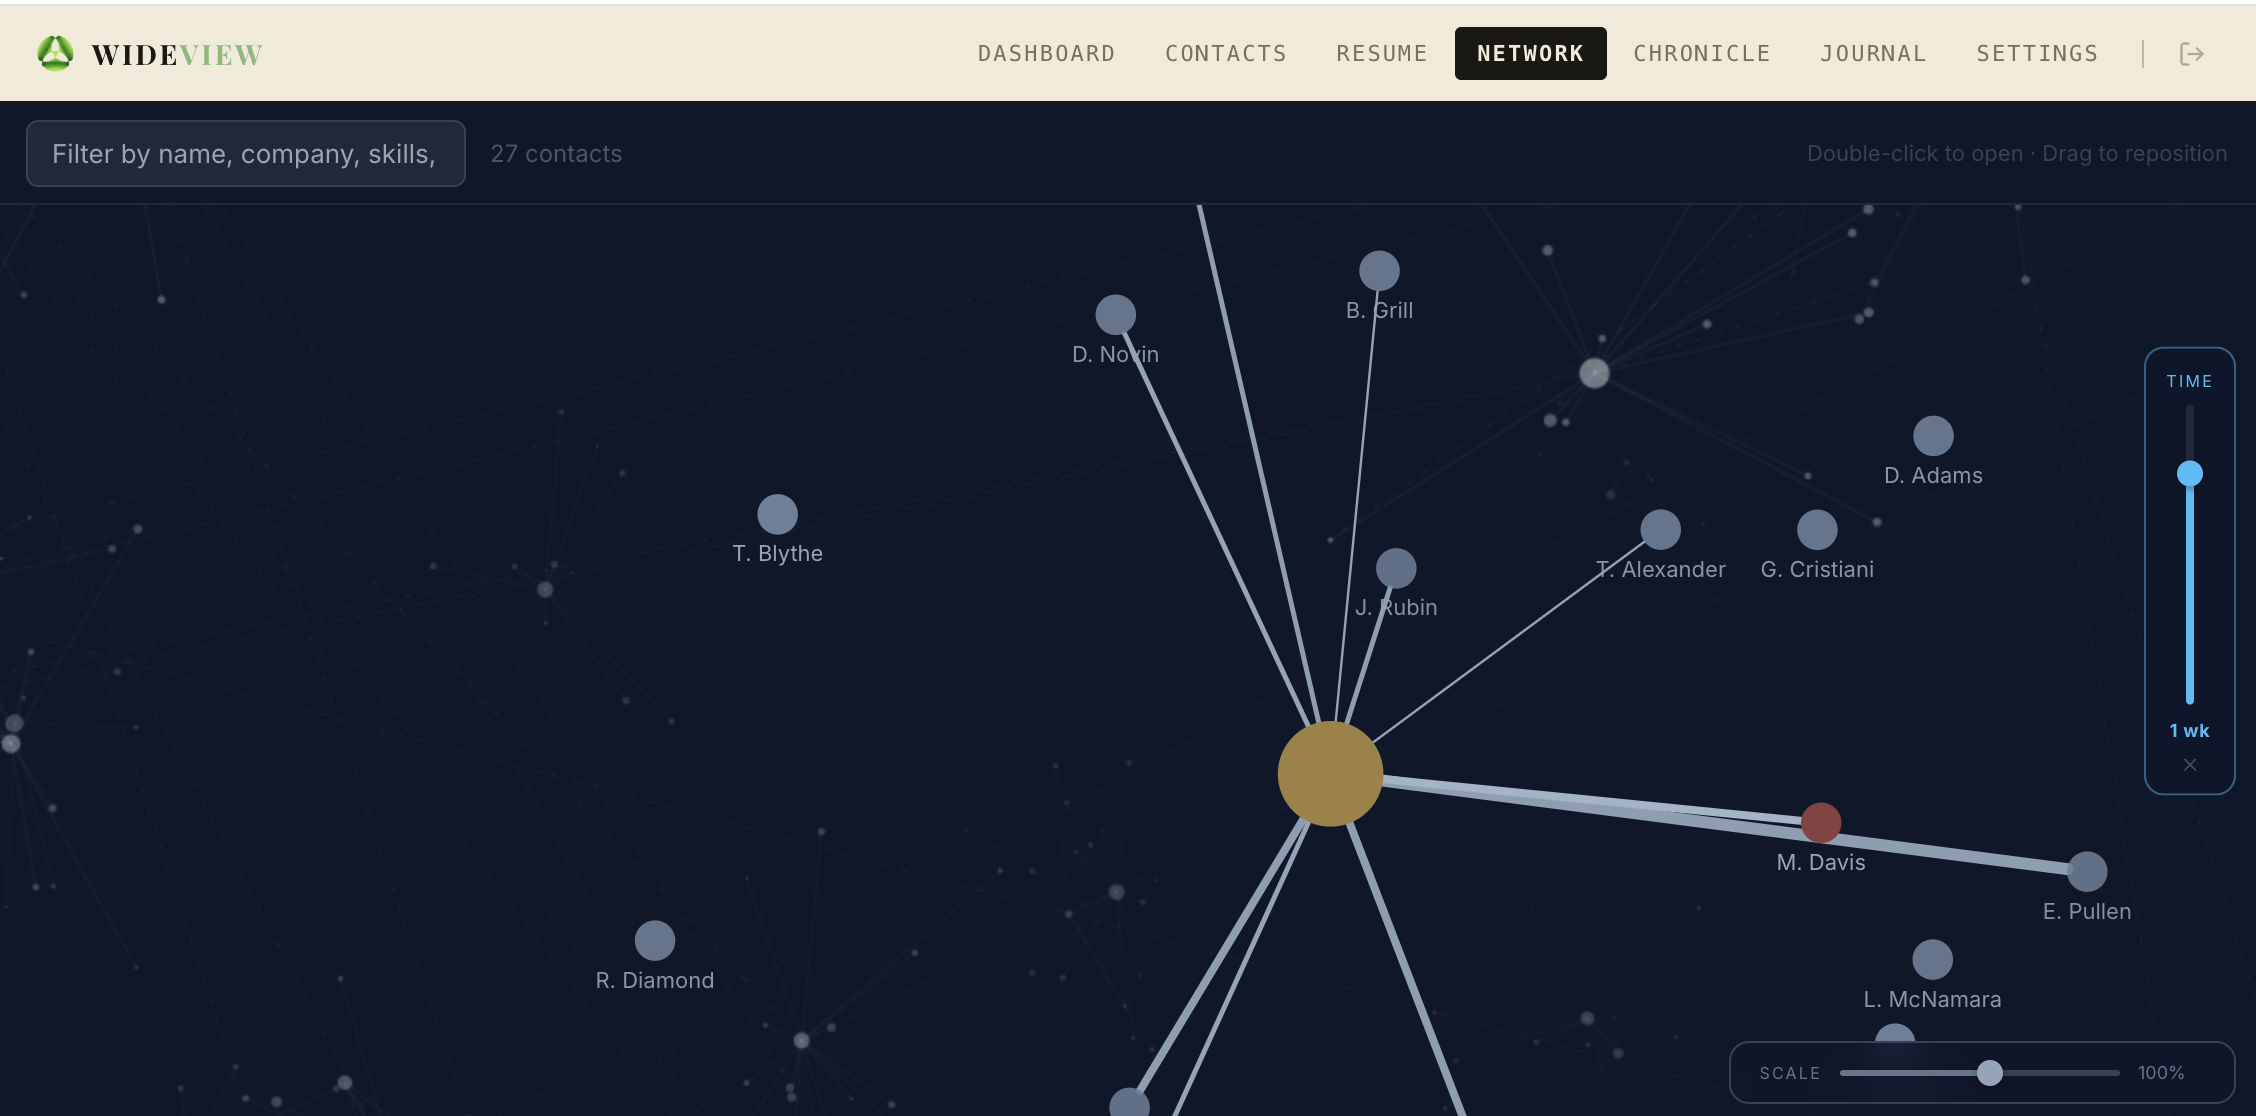
click any node to highlight its connections

Chronicle
Chronicle timeline
1
2
3
4
5
6
7
8
9
1
Scale slider — drag to zoom from 1 year to a 60-year view
2
Colored dot — click to collapse any column to a thin strip; click again to expand
3
Resume linked section — entries here go into your resume and vice versa. Objects can slide up and down in time, or be stretched. New positions feed back to the resume. Any object can be hidden, and any object can have people added to them, which feeds back to your contacts.
4
Column settings gear — add, remove, rename, or reorder your columns
5
People markers — created from contacts but usually default to invisible; they can be shown here.
6
Gatherings — events that occur for a short time, but annually: vacations, conventions, festivals; sometimes they define an era.
7
Tech — it's surprisingly useful to know when certain devices were part of your life. We have a relationship with the tech in our lives.
8
Drag any entry's edge left or right to stretch or shrink its time span
9
People markers can be dragged up or down to fine-tune their exact year position
Network
Network graph
1
2
3
4
5
6
7
1
You — always at the center. This is NOT a social network. It is based on your private dossier on the people you work with and maintain professional connections.
2
Distance from you reflects relationship closeness — as chosen on their contact card.
3
Time scrubber — drag to see smaller segments of time.
4
Node color — usually flat blue, but if you have action items with that person, the priority color shows here.
5
Filter by terms that show up in their contact page.
6
Lines have meaning — a contact gets a line when you start using their CONTACT page. Thickness indicates frequency of communications; opacity of the line and node represents recency — people you're not communicating with will fade.
7
Noting who introduced you — or the context you met — on a CONTACT page creates bonds and clusters in the graph.
Journal
Journal view
1
2
3
4
5
6
7
8
9
10
1
Born field — everything clicks into place once your birthdate is entered; it should already be filled in when you arrive here.
2
Year column — each row is a year of your life; colored dots show how many traits are rated; bold years have written notes.
3
Year header — the selected year and your age at that time.
4
Scroll toggle — switch this screen to a rolling story of your notes across all years.
5
View in Chronicle — jump directly to your Chronicle timeline at this year; helpful when trying to build things there.
6
Context block — auto-filled from the things you entered in the Chronicle, so your notes here don't need to cover those sorts of things.
7
Six traits — rate Happiness, Love, Productivity, Fame, Health, and Wealth on a 0–5 scale. These power your Rhythms chart and give any year a shape at a glance.
8
Notes — write freely: a sentence, a list, a paragraph. No format required. Just your memory of the year.
9
Your photo — add a picture of yourself from this year, just for fun.
10
Clear all (×) wipes the trait values for the year; the arrow (↑) autofills them from the prior year as a starting point.
The Six Traits

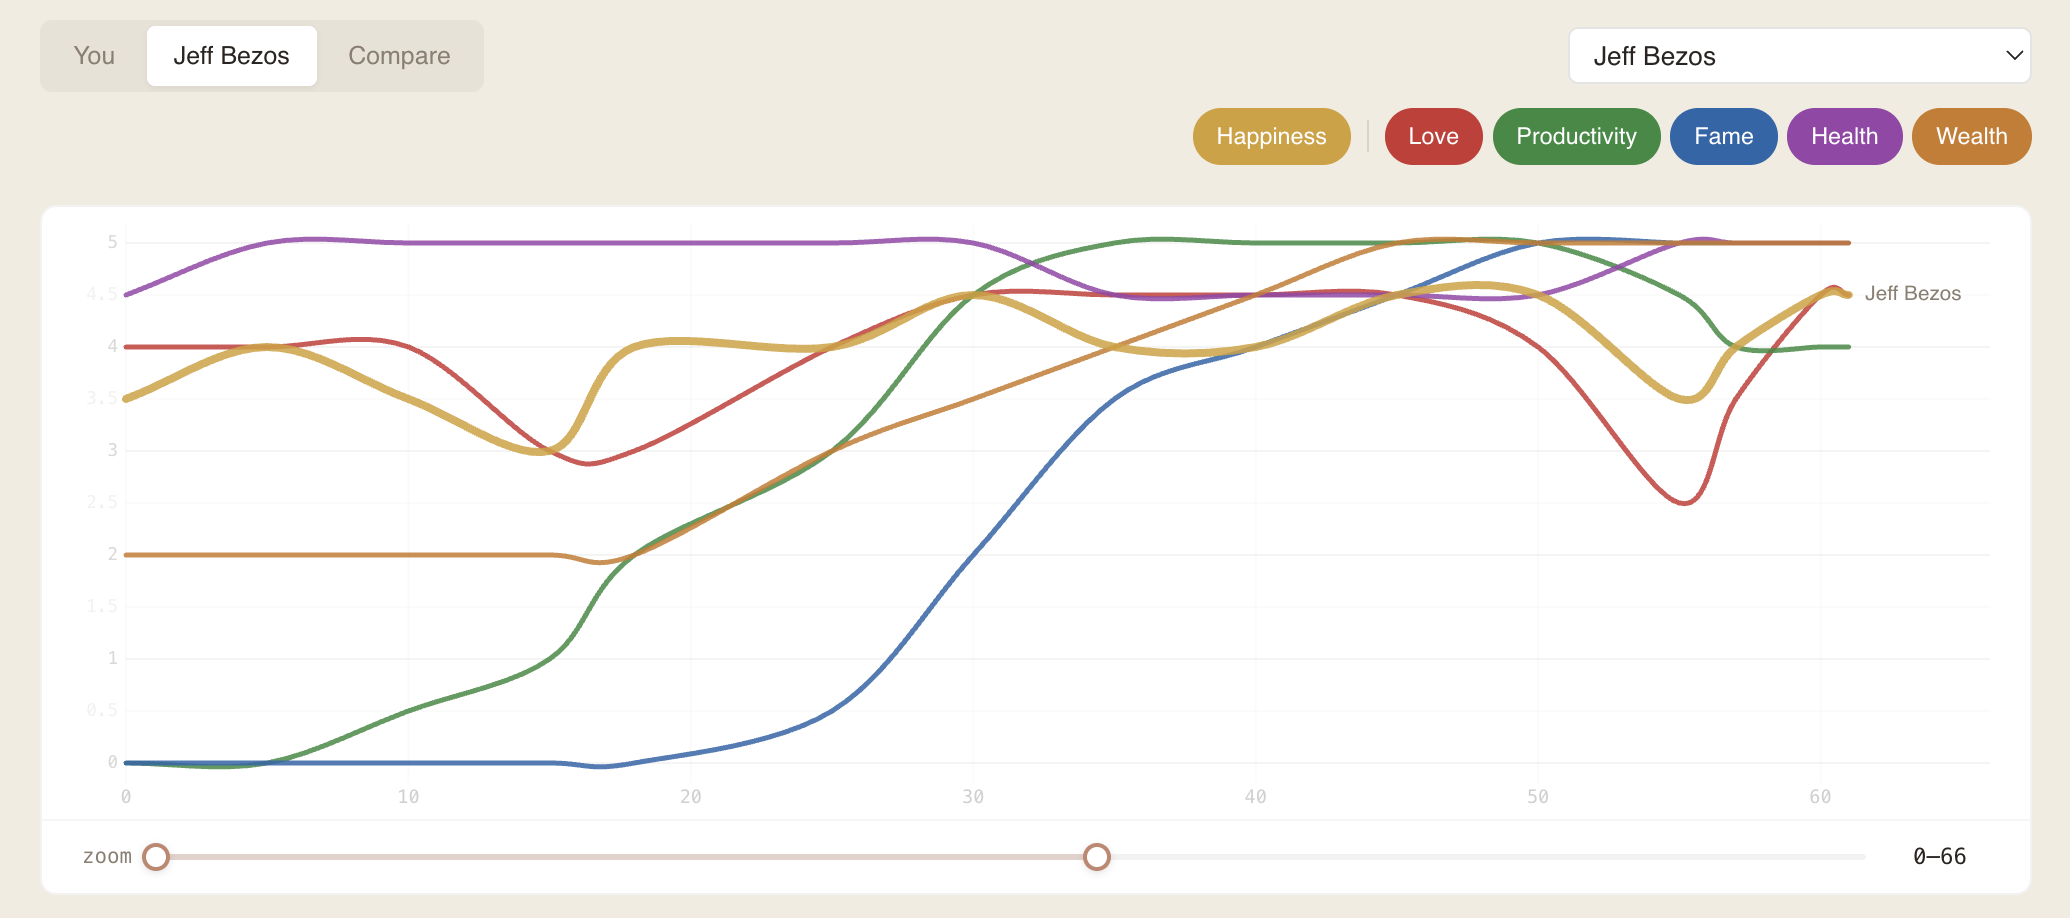
Six dimensions to chart a life

Wideview uses six simple ratings — on a 0–5 scale — to give any year a rough shape at a glance. They are deliberately broad.

Happiness

Overall contentment, peace, spirituality, freedom.

Love

Feeling loved, being in love, or being in a relationship that feels good.

Productivity

Being in the zone. Creating works, having jobs, contributing to the world.

Fame

5 = world-famous · 4 = very famous · 3 = top of a niche · 2 = known in a circle · 1 = friends & family · 0 = unknown

Health

Physical and mental health.

Wealth

Relative wealth: 5 = Top 0.1% · 4 = Top 1% · 3 = Top 10% · 2 = Bottom half · 1 = Bottom quarter · 0 = Destitute

Rhythms chart showing six trait lines across a lifetime
Five lenses on your life

One life, many views

Five ways to see your own data. Each one a different lens on the same life.

Chronicle

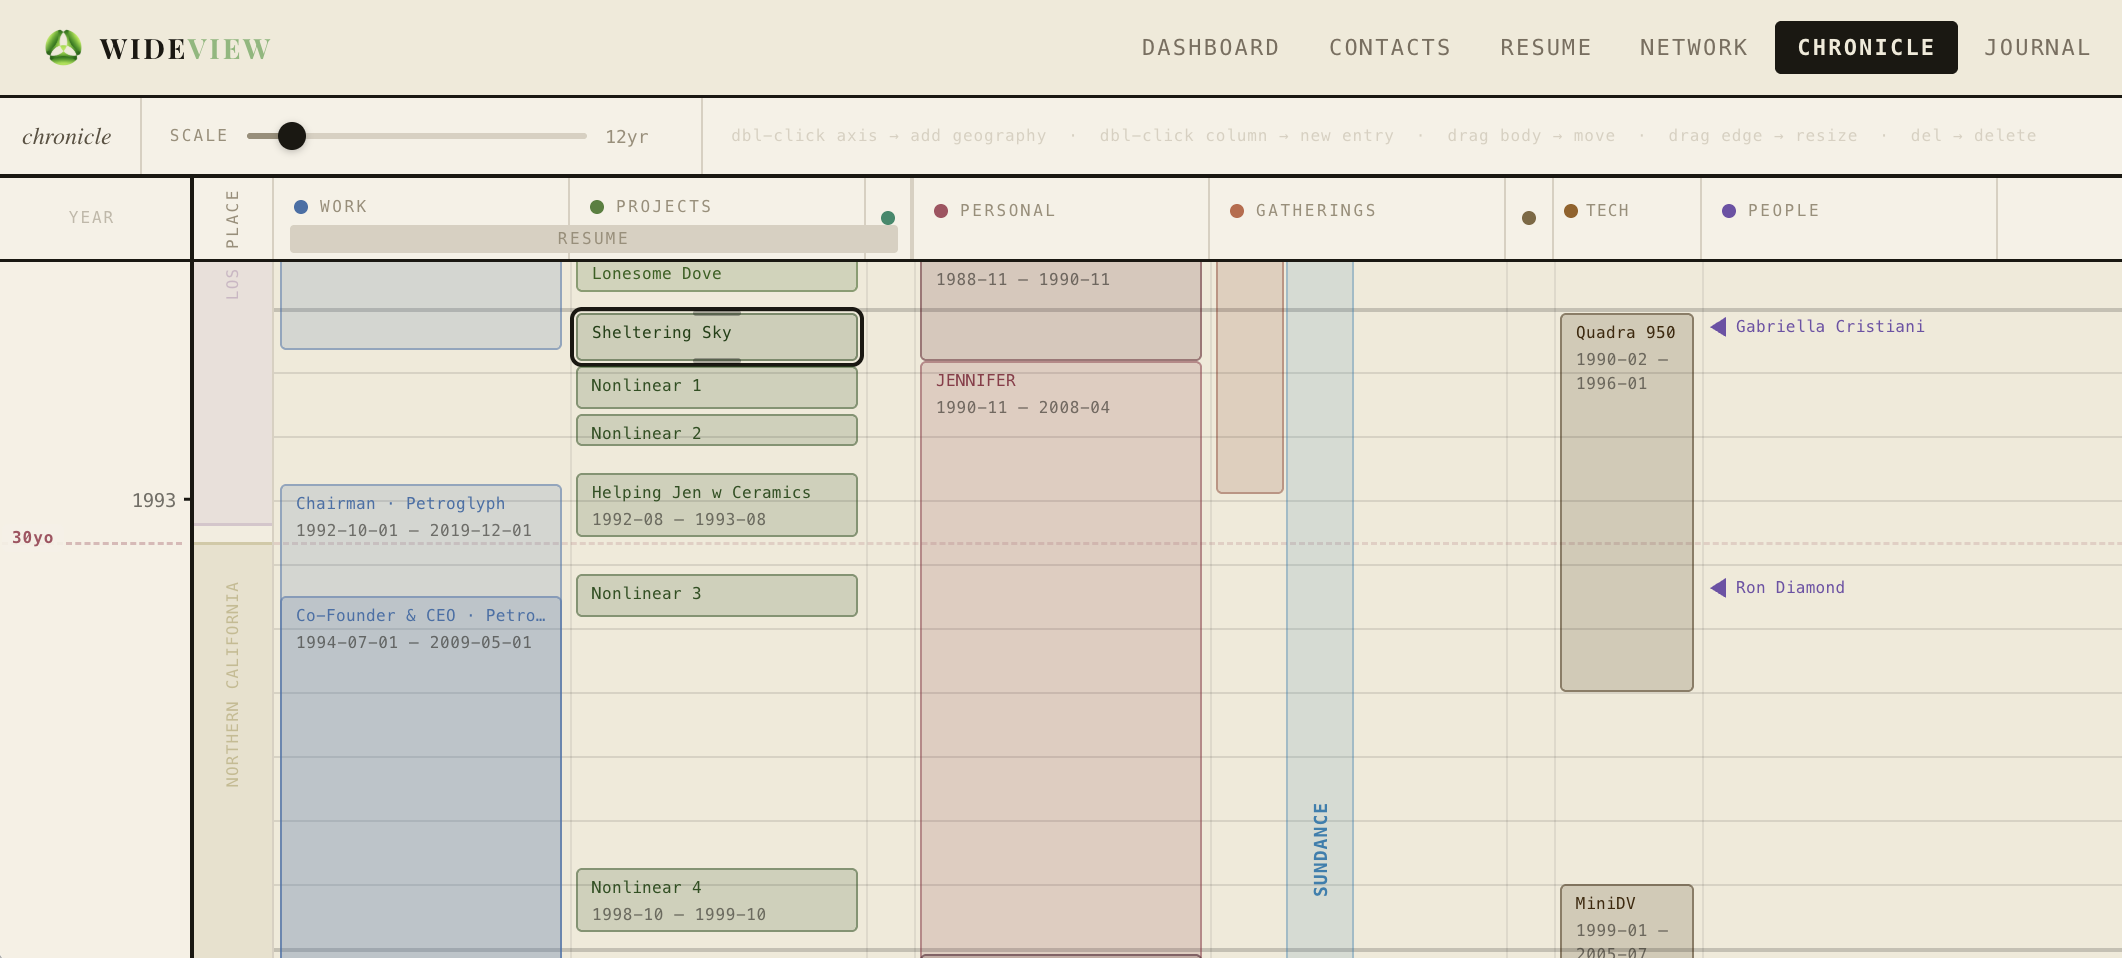
Your whole life on one canvas.

A timeline of your life — jobs, cities, projects, eras, milestones. The shape of your story, laid out so you can finally see it.

Network

The people in your story.

A private map of everyone you know, how they connect, and where your world is richest. Not followers — relationships.

Contacts

Deep memory for people who matter.

Notes, history, context, follow-ups. A private record of every person worth remembering — searchable, yours alone.

Resume

Your career, intelligently organized.

AI reads your history and surfaces patterns. The arc of your work — not just a document, a perspective.

Journal

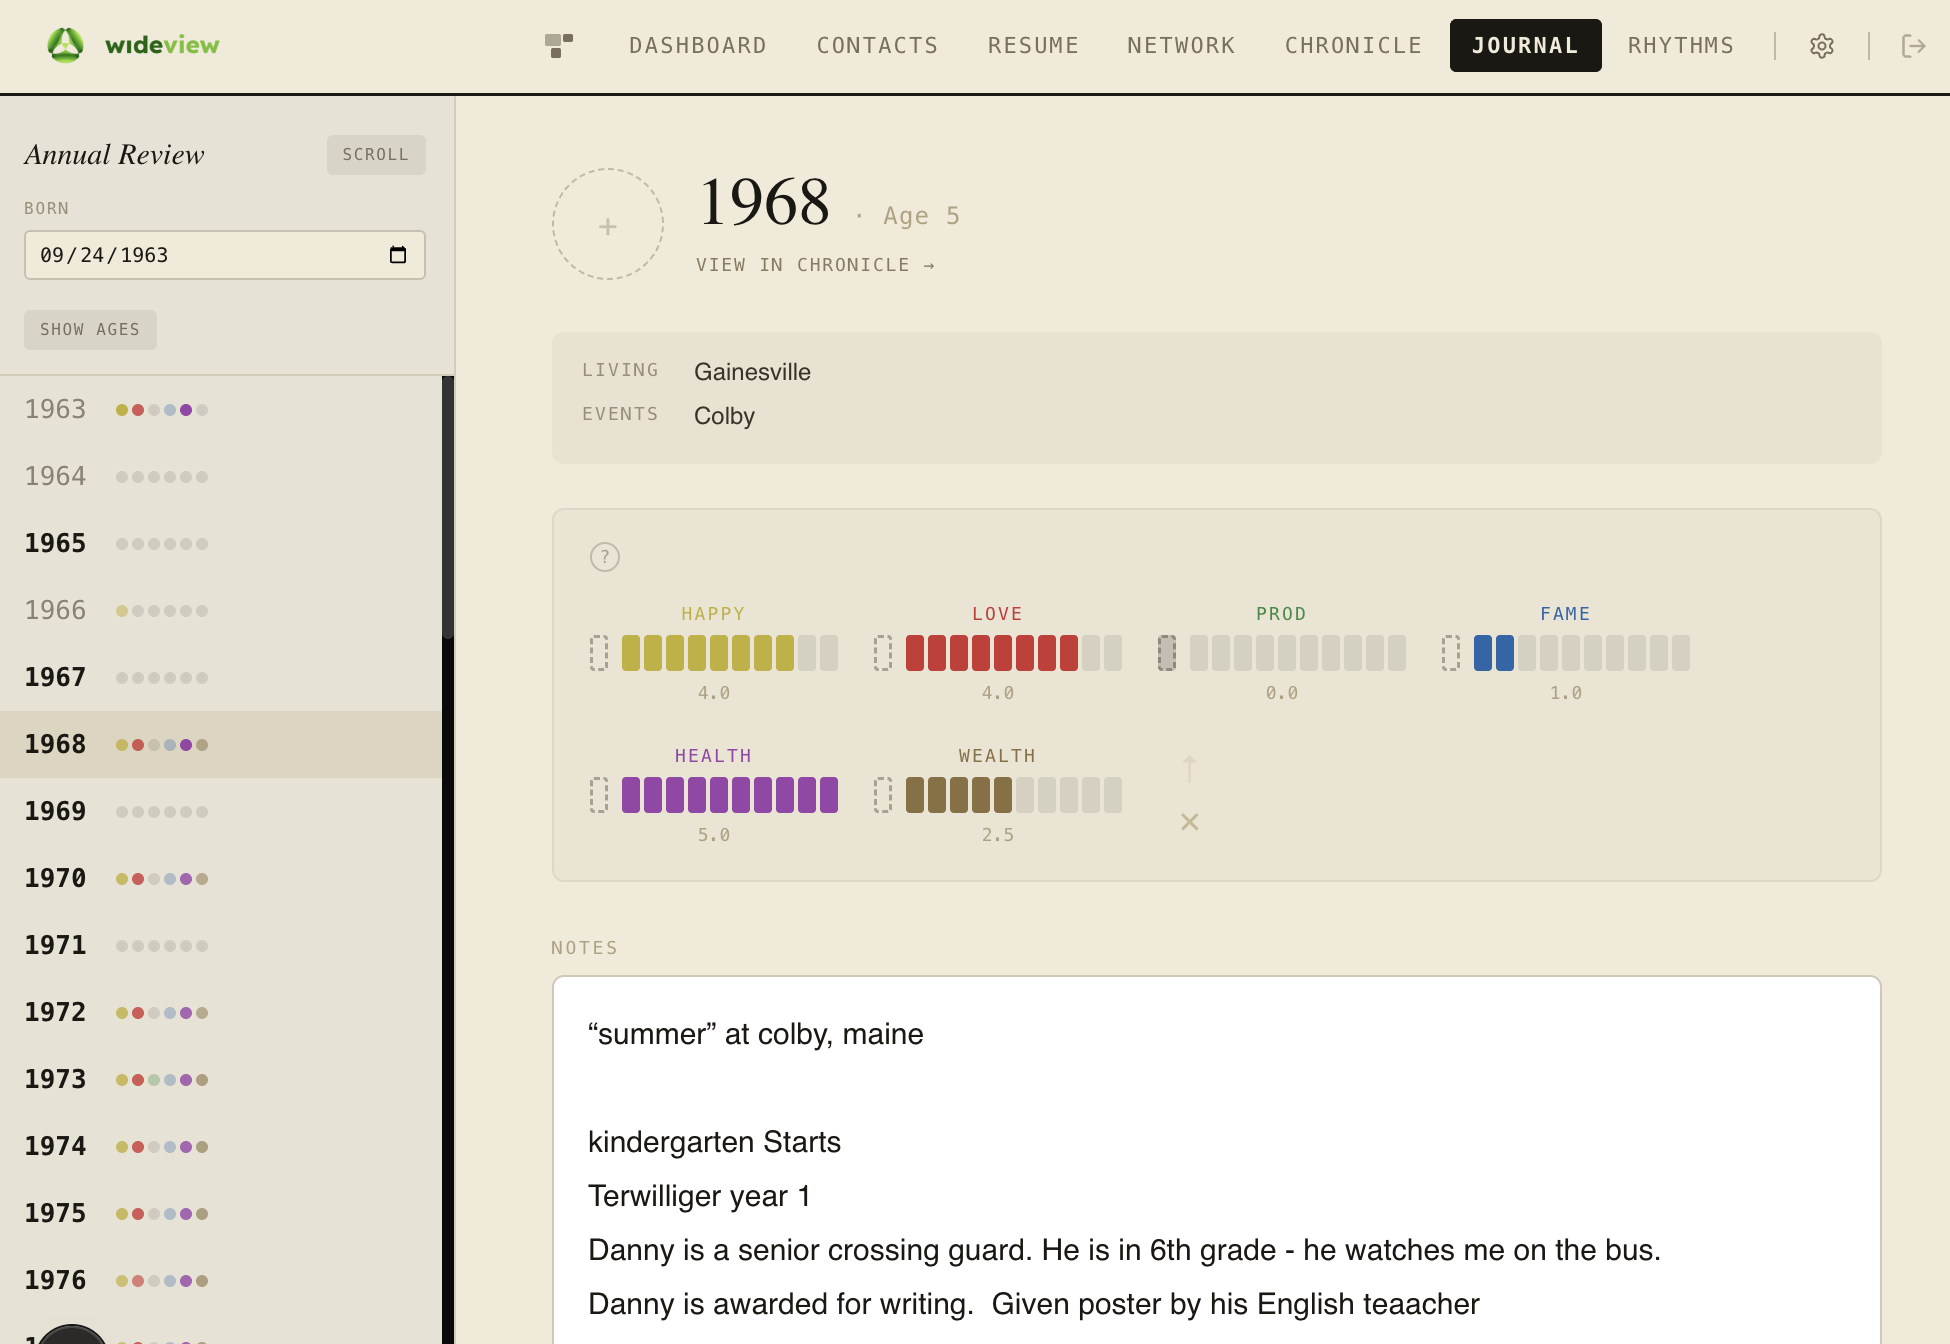
A year at a glance, in your own words.

Not a daily log — more random than that. What you remember, what mattered, what surprised you. Click a year. Write a memory.

An ecosystem with different speeds

Daily

Relationship pulse

Who to follow up with, who's drifting, what you promised. The layer that gives you a reason to open Wideview every day. Without this, the rest dies of neglect.

Weekly

Life maintenance

Chronicle entries, contact notes, resume updates. The small upkeep that keeps the picture current. Ten minutes a week builds something extraordinary over years.

Yearly

Annual review

Journal your year. Tag the people who shaped it. Reflect on what shifted. This is the layer most people never do — and regret it. Wideview makes it almost automatic.

Lifetime

The inheritance

What you pass forward. Not money, not genetics — structured perspective. Your context becomes your children's context. It compounds across generations.